Sample work · Data & Dashboards
Sales Dashboard with filters by region and channel
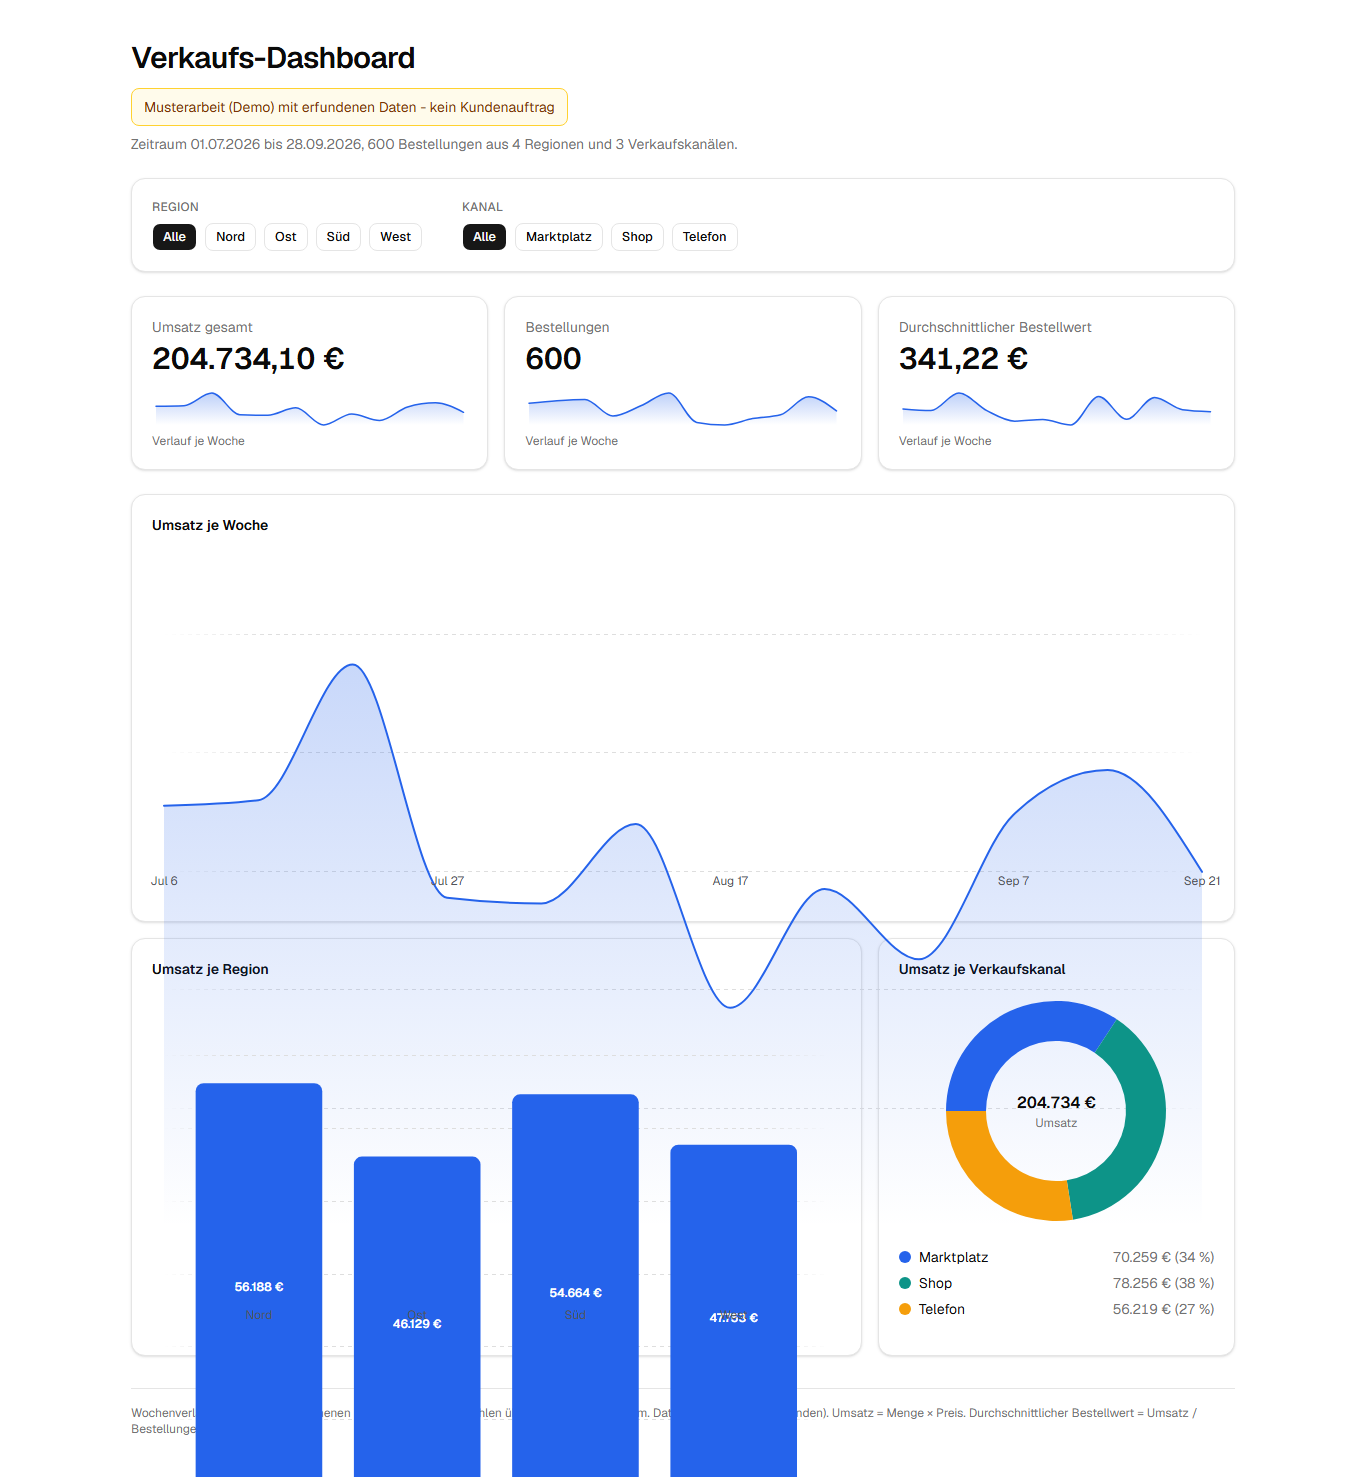
Revenue, orders and order value at a glance, weekly trend, regions and sales channels. A single click on a filter recalculates everything. Runs in the browser, on mobile as well as on desktop.
Sample work (demo), not a client job. Built as a trial task with invented example data; the check figures below come from the automatic test run and are not polished.
What was built
- Key metrics with weekly sparklines, area, bar and donut chart (React, Bklit charts)
- Filters by region and sales channel - totals calculate precisely in cents, verified against source data
- Custom data from CSV, Excel, database or API can be connected

How it was checked
Automatic test run on 2026-10-31, taken from the log (test data invented, figures measured):
- 3/3 filter states: displayed total = pandas control
- all: displayed 204.734,10 € / pandas 204734.10 ok
- south: displayed 54.664,30 € / pandas 54664.30 ok
- south_shop: displayed 20.664,40 € / pandas 20664.40 ok
- Streamlit terminated afterwards: True
Limits
What this sample does not cover, so nobody expects more:
- runs locally (streamlit run); for clients, hosting is required (e.g. Streamlit Community Cloud with client account) or handover as a project folder
- no login/permissions concept in the dashboard itself
- data source in the sample is a CSV; live connection to shop/CRM APIs is separate work per system
- for very large data (> a few million rows) a DuckDB file instead of CSV is necessary - not measured in the sample
- tested with a filter path using Playwright, not every combination and not the visual appearance
Something like this for your business?
Describe briefly what you need. You get a fixed price before I start; nothing happens without your yes.